Speaker III – Tweeter Testing

Testing Methodology

Vifa_Test Focal_Test Test_Baffle_2

Shown above is the rather crude testing methodology that I began with. The white board in the first two pictures is a 40″ x 60″ foam board that can be found at any office supply store. It is about 0.2″ thick, so not particularly strong. I glued an additional piece of foam board on the backside to stiffen up the area around where I mounted the drivers. The last photo shows a double layer, 1.5″ thick “skinny” test baffle that I built, the stand for it, and two more 40″ x 60″ foam boards. The two white circles on the test baffle cover up the mounting holes
for the Vifa and Morel tweeters. All the tweeters were flush mounted for the tests, as was the mid-range.

The frequency and phase responses shown below have to be taken with a grain of salt. Later testing showed that the foam board is at least partially acoustically transparent in the mid-range frequencies, and possibly has a mid-range resonance as well (see The Tweeters, Part 2).
By the time I made this determination, I had already returned the Focal tweeter, so I have not been able to verify which response artifacts are “real” and which are “foam board.” However, discussions with fellow speaker builders verified the Focal’s severe resonance problem above 10 Khz as real. Between that, the unit’s high price, and the poor arival condition, I incurred no emotional loss returning the Focals.

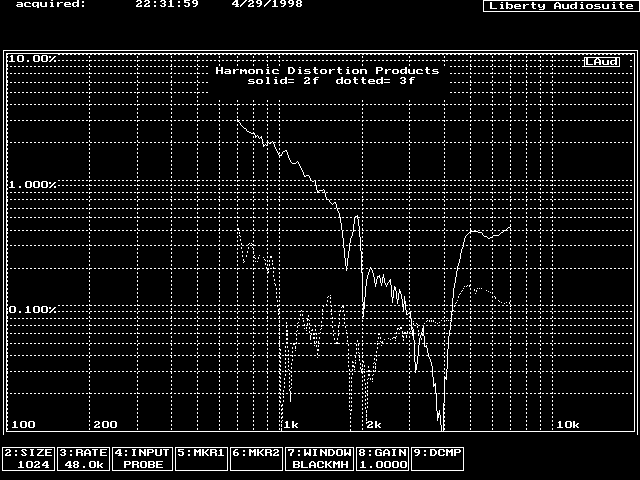
Distortion measurements were all made at a distance of less than an inch to maximize the number of valid data bits. Since the card’s sample rate is just over 40 Khz, 3rd order harmonic distortion measurements above 7 Khz were not possible, nor 2nd order harmonic distortions above 10 Khz.

Vifa D27SG-05 Tests

Frequency Response


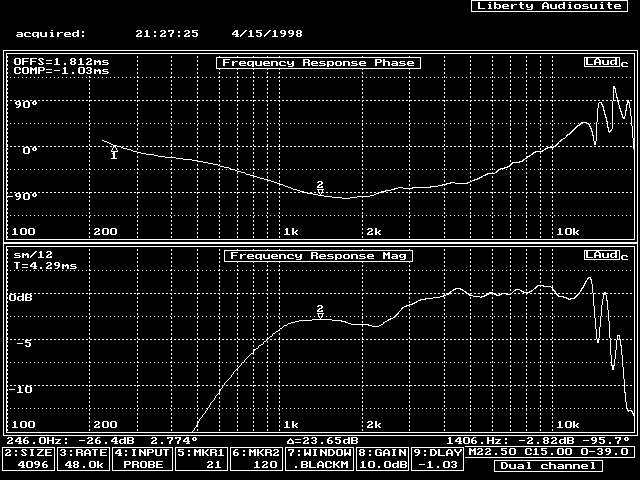
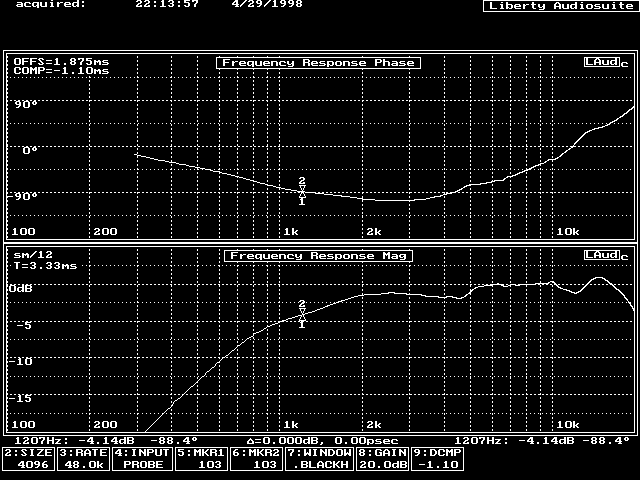
Vifa Frequency Response and Phase Plots

Vifa Frequency Response and Phase Plots

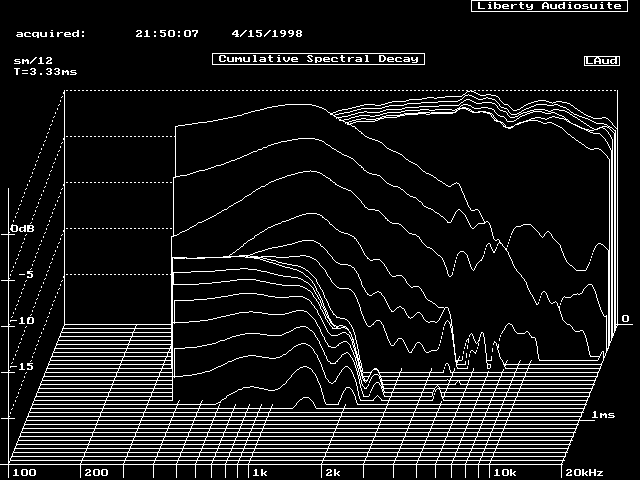
Waterfall CSD

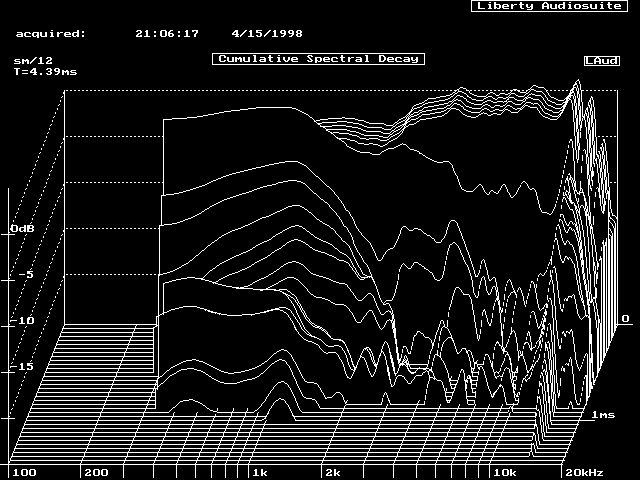
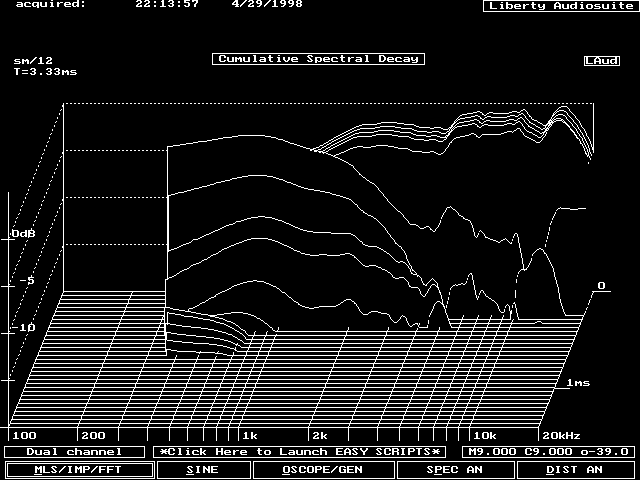
There is some activity associated with the response dip around 7kHz. This indicates some type of possible resonance behavior. As mentioned in the intro, this could be an artifact of the foam board.

Vifa Waterfall Plot

Vifa Waterfall Plot

THD

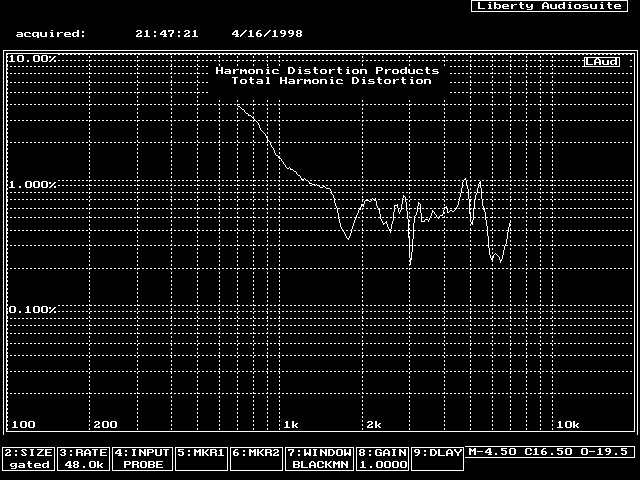
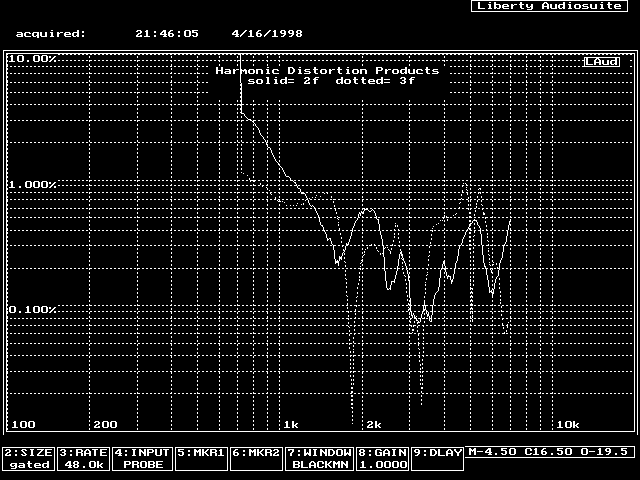
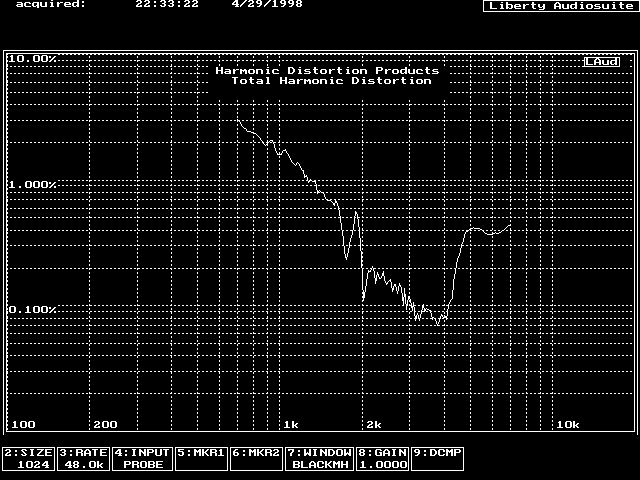
Signal level of -19.5 dB.

Vifa THD

Vifa THD

Vifa (tweeter A) 2nd and 3rd order harmonic distortion

Vifa (tweeter A) 2nd and 3rd order harmonic distortion

Impedance

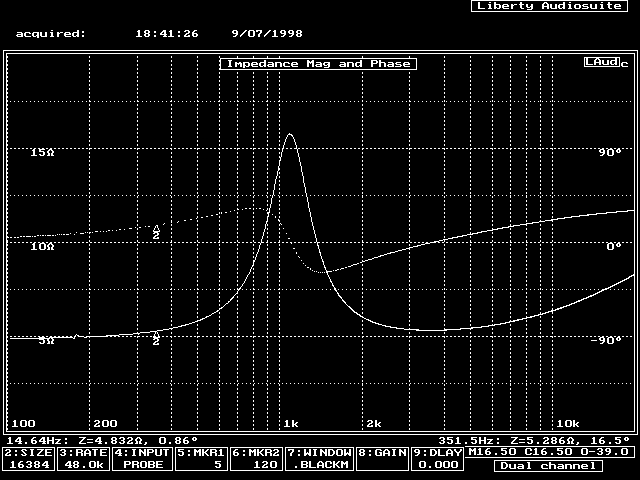
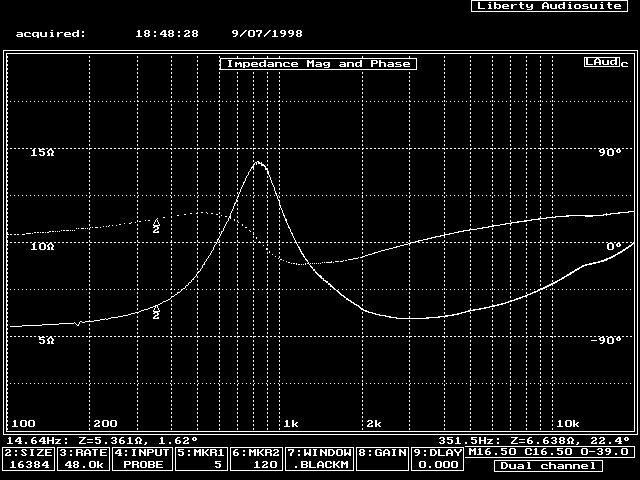
Signal level of -39.0 dB measured while on prototype cabinet 1. This is very smooth and does not indicate any resonance behavior as measured while on the foam board. This smoothness is possibly the result of ferrofluid’s mechanical damping.

Vifa (sample B) Impedance

Vifa (sample B) Impedance


Focal TC90KB

Frequency Response

Notice the dip at 2kHz, and the crazyness above 10 Khz. The dip at 2 kHz is present in Focal’s own response data, as is the wierdness above 10 kHz.

Focal Frequency Magnitude and Phase Response

Focal Frequency Magnitude and Phase Response

Waterfall CSD

Wow, look at the activity above 10Khz! This is pretty bad ringing.

Focal Waterfall Plot

Focal Waterfall Plot

THD

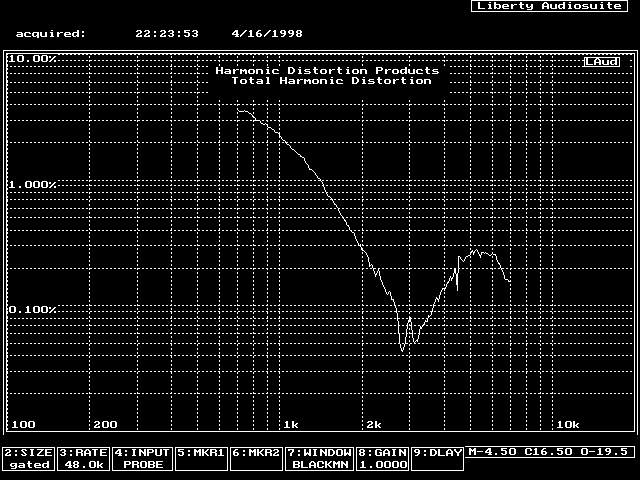
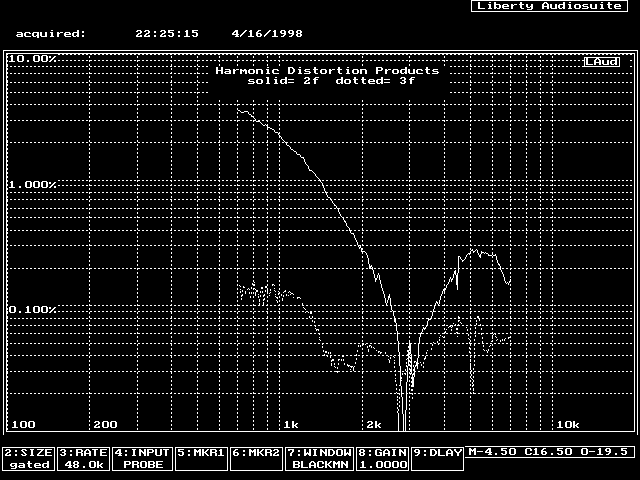
Signal level of -19.5 dB. Notice the Focal unit’s THD is evenly distributed between the 2nd and 3rd harmonics (plot 2 of 2). Both the Vifa and Morel units’ distortions are dominated by 2nd order distortion products. This characteristic is maintained at lower signal levels.

Focal (sample B) THD

Focal (sample B) THD

Focal (sample B) 2nd and 3rd Harmonic Distortion

Focal (sample B) 2nd and 3rd Harmonic Distortion

Impedance

Sorry, no impedance plot for the Focal. However, other data I recorded shows impedance anomylies at 2.5 kHz, 5 kHz, and several above 10 kHz.


Morel MDT-30-S

Frequency response and phase plots.

Notice the small dips at 4.4 kHz and 12 Khz.

Morel (sample A) Magnitude and Phase Responses vs. Frequency

Morel (sample A) Magnitude and Phase Responses vs. Frequency

Waterfall CSD

The peaks/dips seem fairly well damped. However, the z-axis is only 0 to -20 dB whereas on the other drivers the range is 0 to -25 dB. 🙁

Morel (sample A) Waterfall CSD

Morel (sample A) Waterfall CSD

Total Harmonic Distortion

Signal level is -19.5 dB.

Morel (sample A) THD vs. Frequency

Morel (sample A) THD vs. Frequency

Morel (sample A) 2nd and 3rd Harmonic Distortion vs. Frequency

Morel (sample A) 2nd and 3rd Harmonic Distortion vs. Frequency

Impedance

Signal level is -39.0 dB. Note the anomyly around 12-15 kHz. There is also an anomyly around 5 kHz, but it is much more subtle. This indicates a mechanical resonance in the system which can store energy. At higher test signal levels the anomylies are more pronounced.
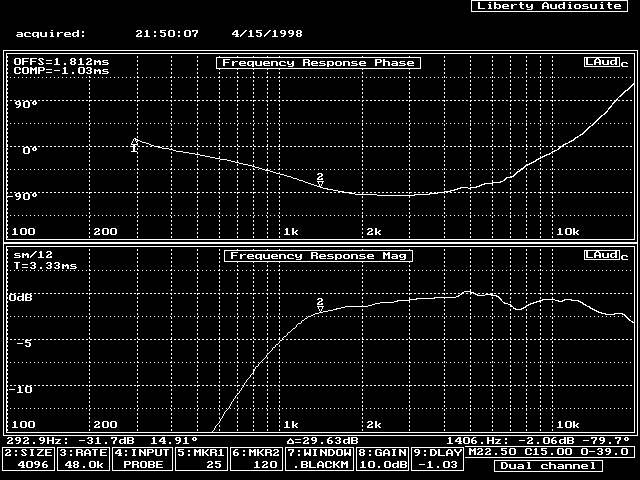
Morel (sample B) Impedance Magnitude and Phase vs. Frequency

Morel (sample B) Impedance Magnitude and Phase vs. Frequency


Copyright © 1998,1999 John Lipp

Speaker III – The Mid-ranges

These are the results of my March 1998 search. Scan-Speak and Peerless are absent; no shielded drivers are available. Dynaudio and Morel place the magnet inside of the driver basket. That placement gives a tight magnet field that is close to, but I don’t believe as good as, bucking magnet shielding. Eton makes a 4″ shielded mid (at $98), but nothing larger.

Seas also makes some shielded co-axial drivers; a mid-range with the tweeter located
where the dustcap is normally found. The mid’s cone acts as a horn on the tweeter and modulates the tweeter’s output via the mid’s cone motion. The latter is a non-linear distortion. Why then would anyone use a co-axial driver? The big reason is the co-location of the mid-range and the tweeter. The time delay between them is minimized, and almost invariant with changes in the listening axis. The modulation distortion is minimized by limiting the mid-bass and bass content sent to the mid. A 400 Hz cross-over to another mid-range or mid-bass unit has been commercial used to accomplish this task. Since the project goal is an MTM, not an WTMW (W for woofer), no co-axials were considered.

Param Vifa Vifa Vifa Focal Seas Seas
Model M17SG-09 P17SJ-00 ??? 5N411LB P14RC/TV (H626) P17RE/TV (H690)
Price [1998] $33.50 $34.90 $46.70 $84.50 $42.20 $52.50
Size 5″ 6.5″ 6.5″ 5″ 5″ 6.5″
Material Paper Paper Poly Neoflex Poly Poly
Fs [Hz] 54 34 41 45 40 34
Qts 0.35 0.34 0.35 0.35 0.21 0.27
Efficiency [dB/2.83v] 88 89 87 87.5 89.5 88.5
Vas [l] 12 53 33 14 18.9 30.5
Xmax [mm] 2 3 4 3.25 3 3
Power [w] 35 50 70 60 60 80

These prices were “current” of 03/31/98 from Madisound. Xmax ratings are peak one way.

The Vifa D27SG-05 does not have “tinsel leads” or a similar technology. I interpret this to mean a crossover frequency below 3 kHz is not likely to lead to long term tweeter reliability.  A crossover frequency above 3kHz limits the mid-range selection to 5″ or smaller drivers.

This is not a cost-is-no-object design, which yields the Vifa M13SG-09 and Seas P14RC/TV as the two best candidates. The P14RC/TV manufacturer response curves shows some response anomylies in the 1-2 kHz region where the human ear is most sensitive. My conclusion: get the Vifa M13SG-09.

The measurements of the Vifa M13SG-09 were good enough that no other units have been examined.

Vifa M13SG-09

Vifa _M13SG-09-08 The raw driver. Several points are worth noticing. The translucent plastic tabs placed in the mounting screw holes keep the surround from getting crushed during shipment. Very Nice!
The magnets (one is a bucking magnet, placed such as to cancel out the magnetic field of
the other) are covered with a steel cup.Although the cone is paper, it appears quite shiny. This is from a plastic coating, which gives the mid a “wet” look. The dustcap is well damped, but is not soft like the Vifa poly mid.
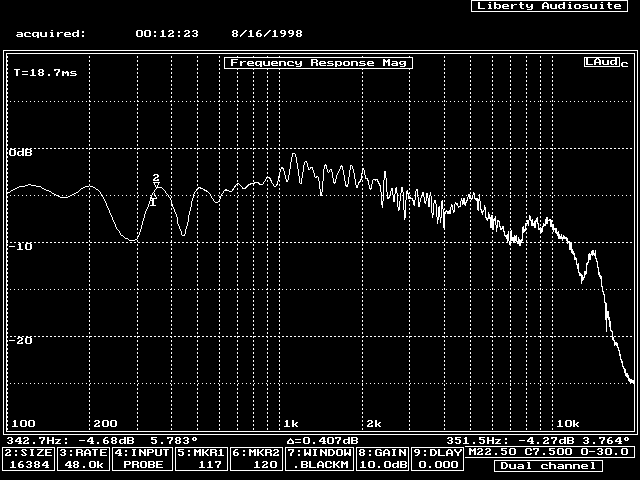
vas_cabinet The first frequency response test was performed on a small test box that was also used
for calculating driver Vas. The measurement distance was 46 cm and the time window is about 18.6 milliseconds.The small dimensions of the test cabinet make it difficult to evaluate which of the response
anomilies can be traced to the driver. The manufacturer’s data sheet shows a broad 1-2 dB dip at 2 kHz and a narrow 3-5 dB dip at 6.5 kHz.
Mid (sample a) Magnitude Response vs. Frequency

Mid (sample a) Magnitude Response vs. Frequency

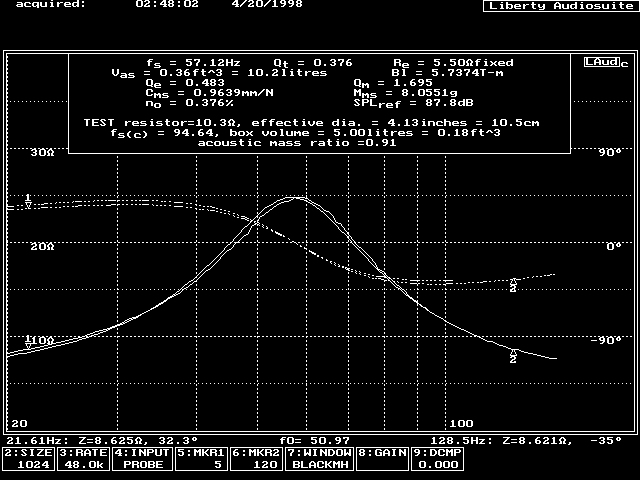
The LAud results of mid-range B tested for its Thiele-Small parameters.

Mid (sample B) Thiel/Small Parameter Test

Mid (sample B) Thiel/Small Parameter Test

The table below summarizes the Thiele-Small testing I have done so far on the dozen mid-ranges that I ordered. (Yep, a dozen!) The results are before any break-in of the suspensions. The test signal level was -30 dB.

Spec A B C D E F G H I J K I
Re [ohm] 5.6 5.6 5.5 5.6 5.45 5.5 5.6 5.5 5.5 5.6 5.6 5.6 5.6
fs [Hz] 54 54.45 57.71 57.25 55.31 56.63 57.96 56.19 54.22 52.87 53.82 56.95 58.26
Qts 0.35 0.370 0.383 0.379 0.356 0.351 0.349 0.371 0.351 0.368 0.352 0.352 0.373
Vas [l] 12 11.5 10.2 N/A N/A N/A N/A N/A N/A N/A N/A N/A N/A


Copyright © 1998 John Lipp